Build a table visualization extension using nebula.js
In this tutorial, you’ll build a table visualization extension using nebula.js, learning key concepts like data
configuration, rendering, interactivity, and deployment.
What you’ll learn
By the end of this tutorial, you’ll have:
- Created a nebula.js extension project using the CLI
- Configured the extension to accept dimensions and measures through the property panel
- Rendered data from the Qlik Associative Engine as an HTML table
- Implemented row selection with visual feedback
- Built and packaged the extension for Qlik Cloud
Prerequisites
Before you start, ensure you have access to the following:
- Node.js (version 24 or newer)
- A terminal
- A modern web browser (for example, Google Chrome)
- A text editor or IDE (for example, Visual Studio Code)
- A Qlik Cloud Analytics tenant with a web integration configured
(or the ability to request that an administrator create one). The URL to the nebula web development server,
such as
http://localhost:8000, should be added to the allowlisted origins when you create your web integration.
Create a project
Run the following command to create a new nebula.js extension project called first-extension:
npx @nebula.js/cli create first-extension --picasso none --pkgm npmThe --picasso none option tells the command to not create a
picasso visualization template, other options are minimal and barchart.
The --pkgm npm option makes the command use npm; without it, the CLI uses yarn if it’s installed
locally, and falls back to npm otherwise.
The command scaffolds a project into the /first-extension folder with the following
structure:
/srcdata.js- Data configurationext.js- Extension settingsindex.js- Main entry point of this visualizationmeta.json- Metadata for the extensionobject-properties.js- Default object properties
/test- Integration testspackage.json
The project also contains dotfiles that provide linting and code formatting.
Start the development server
- Run the following commands to start the development server:
cd first-extensionnpm run startThe command starts a local development server and opens up http://localhost:8000 in your browser.
-
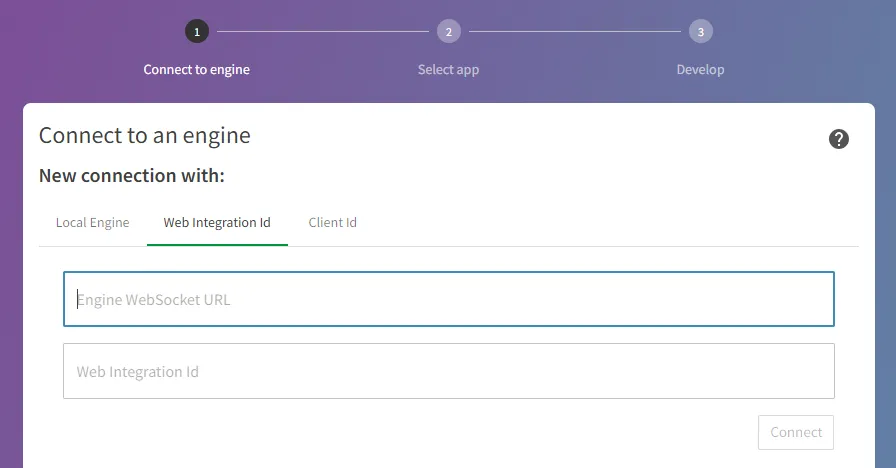
Select Web integration ID as the connection type.
-
Enter the WebSocket URL for your Qlik Cloud tenant, for example
wss://<TENANT>.<REGION>.qlikcloud.com. -
Enter the web integration ID for the web integration that includes
http://localhost:8000as an allowed origin. -
Select Connect.
-
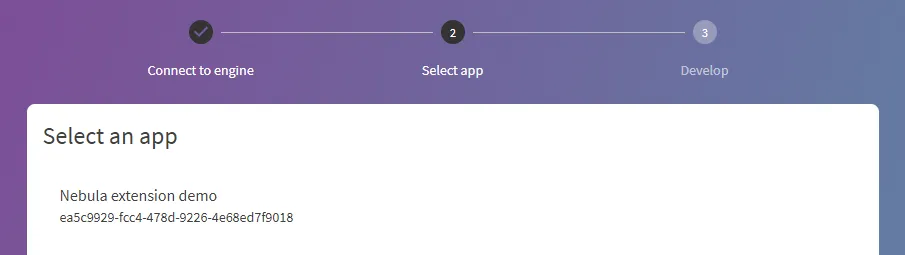
Select an app to connect to.
You are redirected to the main developer UI, where you can see your visualization rendered:
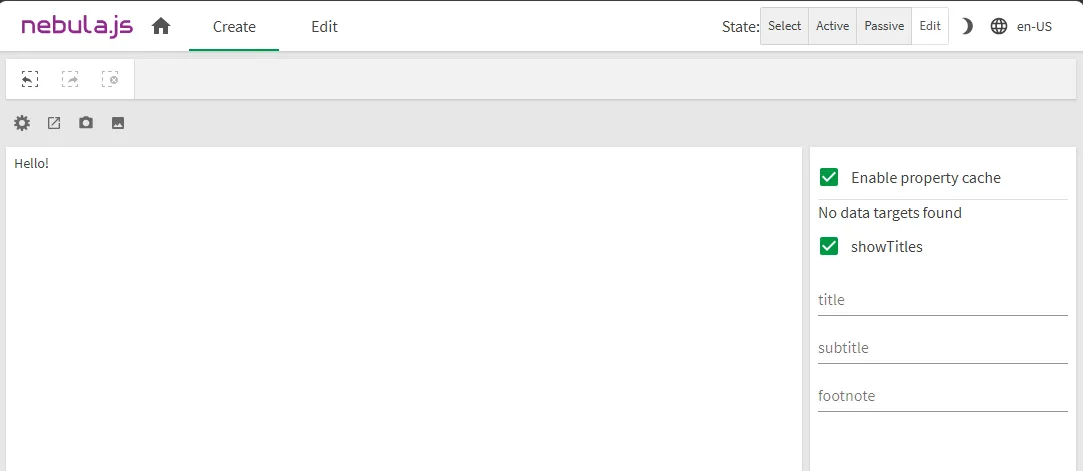
Any updates in /src/index.js that affect the output automatically cause a
refresh of the visualization. You can see the changes immediately.
If the changes do not appear, try running nebula build in a new terminal and refresh the browser.
Configure data structure
The qHyperCubeDef property in src/object-properties.js defines the initial data fetch from the engine.
The targets property in src/data.js defines the data structure and constraints for dimensions and measures,
which surfaces the appropriate pickers in the property panel.
-
Add a
qHyperCubeDefdefinition insrc/object-properties.js:const properties = {qHyperCubeDef: {qInitialDataFetch: [{ qWidth: 2, qHeight: 10 }],},// ... other properties};The
qWidth: 2specifies the initial data fetch: how many columns to request from the engine on first load. Themax: 2constraint set insrc/data.jsis separate: it controls how many fields users can add through the property panel picker. -
Add
/qHyperCubeDefas a data target insrc/data.js, including thedimensionsandmeasuresconstraints that tell nebula.js what to surface in the property panel:export default {targets: [{path: '/qHyperCubeDef',dimensions: { min: 0, max: 2 },measures: { min: 0, max: 2 },},],};
Configure the property panel
src/ext.js is only used when the extension runs inside the Qlik Sense or Qlik Cloud client: it defines
the property panel accordion shown there. It has no effect on the nebula.js development server, where the
property panel already lets you add dimensions and measures based on the dimensions and measures
constraints you set on the target in src/data.js.
Add a definition property to the returned object in src/ext.js so the same accordion appears when the
extension is loaded in Qlik Sense or Qlik Cloud:
export default function ext(/* galaxy */) {  return {    definition: {      items: { data: { uses: 'data' }, settings: { uses: 'settings' } },    },
    support: {      snapshot: false,      export: true,      sharing: false,      exportData: true,      viewData: true,    },  };}
The definition.items object configures the property panel accordion:
{ uses: 'data' }adds the data section, which surfaces dimension and measure pickers.{ uses: 'settings' }adds common settings such as titles.
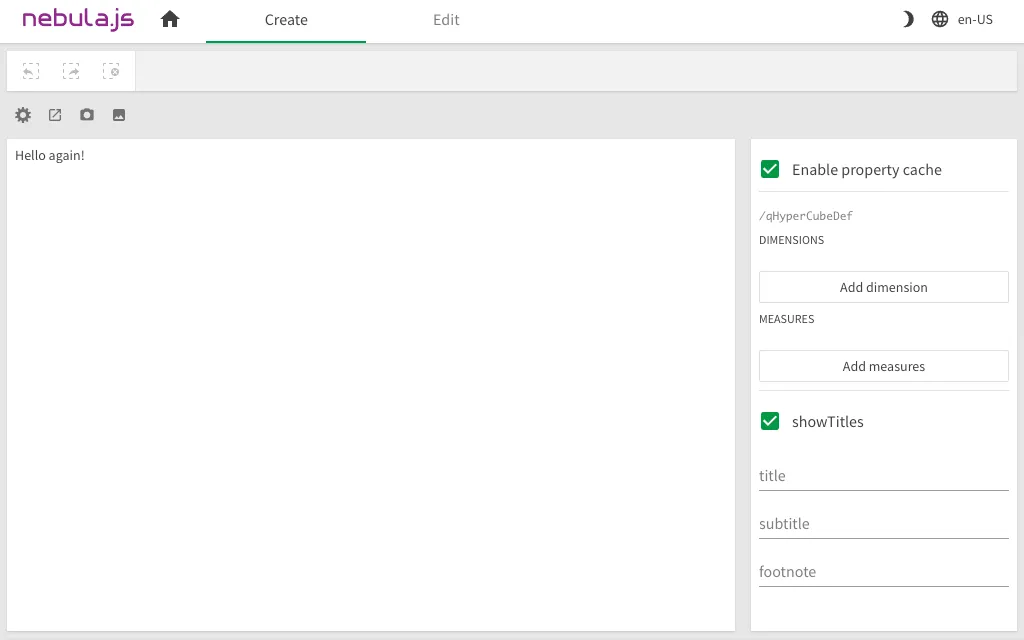
With the qHyperCubeDef target configured in src/data.js, you should already have the option to add
data from the property panel on the right:
Render data and implement selection
The visualization logic lives in src/index.js.
In this file, the component reads the hypercube layout returned by the Qlik Associative Engine, renders the selected dimensions and measures as an HTML table, and sends row selections back to Qlik Cloud.
The code uses the following nebula.js hooks:
useElement()provides the DOM element where the visualization renders.useLayout()provides the latest layout, including hypercube data.useSelections()starts and applies selections.useState()tracks the rows selected in the table.useEffect()updates the rendered output when data or selection state changes.
Replace the content of src/index.js with the following code:
index.js example
import {  useElement, useLayout, useEffect, useSelections, useState,} from '@nebula.js/stardust';import properties from './object-properties';import data from './data';import ext from './ext';
export default function supernova(galaxy) {  return {    qae: {      properties,      data,    },    ext: ext(galaxy),    component() {      const element = useElement();      const layout = useLayout();      const selections = useSelections();      const [selectedRows, setSelectedRows] = useState([]);
      // Render table with data from the hypercube      useEffect(() => {        if (layout.qSelectionInfo.qInSelections) {          // Skip rendering during selection mode          return;        }        const hc = layout.qHyperCube;        if (!hc || !hc.qDataPages || !hc.qDataPages[0]) {          element.innerHTML = '<div>Add dimensions and measures to display data.</div>';          return;        }
        // Build table headers from dimension and measure names        const columns = [...hc.qDimensionInfo, ...hc.qMeasureInfo].map((f) => f.qFallbackTitle);        const header = `<thead><tr>${columns.map((c) => `<th>${c}</th>`).join('')}</tr></thead>`;
        // Build table rows with data-row attribute for selection tracking        const rows = hc.qDataPages[0].qMatrix          .map(            (row, rowIdx) => `<tr data-row="${rowIdx}">${row.map((cell) => `<td>${cell.qText}</td>`).join('')}</tr>`,          )          .join('');
        const style = `          <style>            tr.selected {              background-color: #eee;            }          </style>        `;
        element.innerHTML = `${style}<table>${header}<tbody>${rows}</tbody></table>`;      }, [element, layout]);
      // Handle row clicks to toggle selection      useEffect(() => {        const listener = (e) => {          if (e.target.tagName === 'TD') {            if (!selections.isActive()) {              selections.begin('/qHyperCubeDef');            }            const row = +e.target.parentElement.getAttribute('data-row');            setSelectedRows((prev) => {              if (prev.includes(row)) {                return prev.filter((v) => v !== row);              }              return [...prev, row];            });          }        };        element.addEventListener('click', listener);        return () => element.removeEventListener('click', listener);      }, [element, selections]);
      // Highlight selected rows      useEffect(() => {        if (!layout.qSelectionInfo.qInSelections) {          return;        }        element.querySelectorAll('tbody tr').forEach((tr) => {          const idx = +tr.getAttribute('data-row');          tr.classList.toggle('selected', selectedRows.includes(idx));        });      }, [element, selectedRows, layout]);
      // Apply selections to the Qlik engine      useEffect(() => {        if (selections.isActive()) {          if (selectedRows.length) {            selections.select({              method: 'selectHyperCubeCells',              params: ['/qHyperCubeDef', selectedRows, []],            });          } else {            selections.select({              method: 'resetMadeSelections',              params: [],            });          }        } else if (selectedRows.length) {          setSelectedRows([]);        }      }, [selections.isActive(), selectedRows, selections]);    },  };}
This code renders the table when the layout changes.
Each table row stores its row index in a data-row attribute so the handler can identify which row was selected.
When a row is selected, the component starts a selection session on /qHyperCubeDef, updates the selected row state,
highlights the selected rows, and applies the row selection to the Qlik engine.
Test the extension locally
Your extension is now complete. Test it in the nebula.js development environment.
- Run the following command to start the development server:
npm run start-
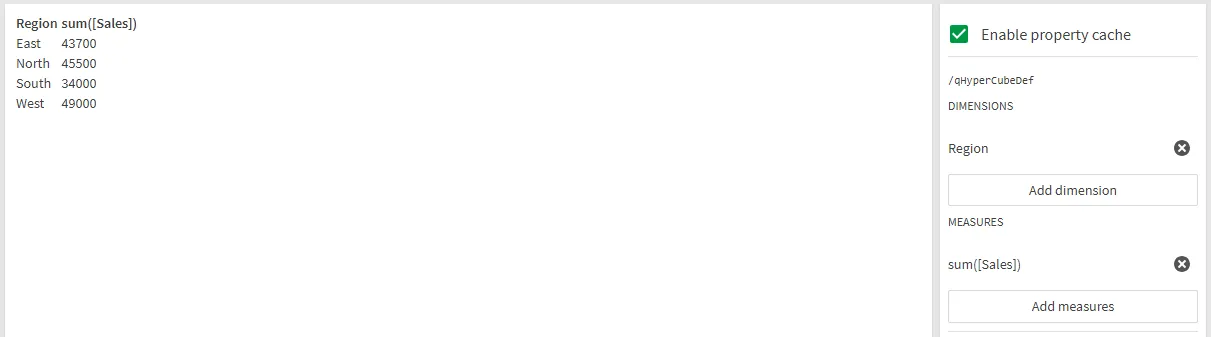
Add dimensions and measures using the property panel on the right.
-
Verify that the table renders with your selected dimensions and measures as columns.
Build and upload the extension
With the extension working locally, you can now build and package it for deployment to your Qlik Cloud tenant.
- Generate a bundle into the
/distfolder:
npm run build- Generate the required Qlik Sense metadata files:
npm run senseThis command creates a /first-extension-ext folder containing the .qext manifest and bundled JavaScript.
-
Zip the
/first-extension-extfolder. -
Upload the extension to your Qlik Cloud tenant. For more information, see Uploading and managing visualization extensions on Qlik Help.
To upload an extension to your Qlik Cloud tenant, you must have one of the following roles:
Tenant AdminroleAnalytics Adminrole- Custom role with the Manage extensions (
admin.extensions) permission set to Allowed assigned
Test the extension in Qlik Cloud
You can test the extension in your Qlik Cloud tenant by adding it to a sheet in an app.
-
In your Qlik Cloud tenant, open an app and create or edit a sheet.
-
In the Assets panel, select Custom objects, find your extension, and drag it onto the sheet.
-
In the property panel, add one or more dimensions and measures.
-
Verify that the extension renders the selected data as a table.
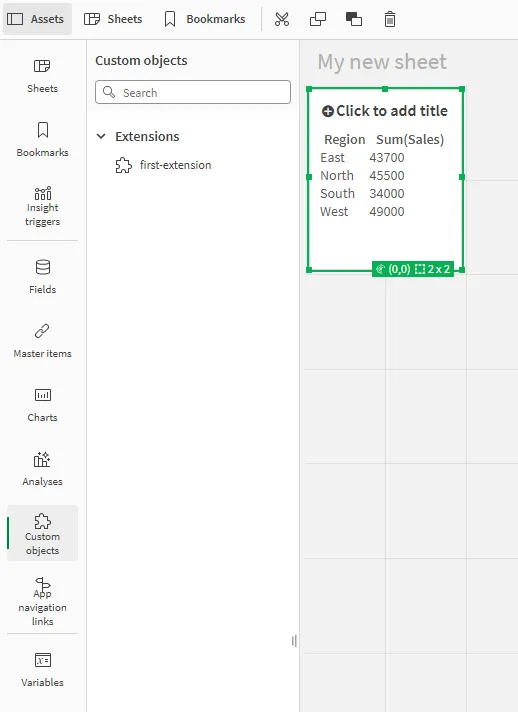
You can now use the extension in your Qlik Cloud apps, and it will render data as a table with interactive row selection.
Summary
You’ve built, tested, and packaged a working nebula.js visualization extension. The extension demonstrates core concepts:
- Data configuration via
data.jsconstraints that surface dimension/measure pickers - Property panel definition in
ext.jsusing the standarduses: 'data'anduses: 'settings'pattern - Data rendering with hooks (
useLayout,useEffect) to access hypercube data - Interactive row selection with visual highlighting and selection broadcasting to the Qlik engine
- Deployment by building and packaging a Qlik Sense visualization extension for Qlik Cloud
Next steps
Now that you’ve built and tested a table visualization extension, you can continue by adding more configuration options to the property panel, such as table styling, display labels, or limits for the number of rows displayed.